Module flot
Generating Pretty Plots with Flot
A llib flot program generates an HTML file containing flot plots, which you can then open in your browser.
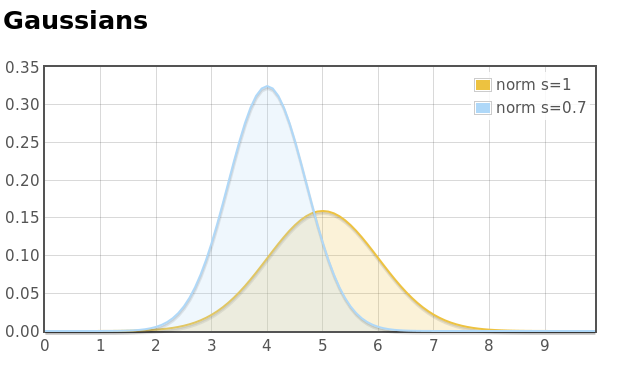
For example, this example will generate a ‘norm.html’ file.
By default, this file will have Internet references to Flot and jQuery, which makes it a self-contained document suitable for giving to others. However, for situations where one is offline or simply don’t enjoy the latency, you can define LLIB_FLOT to be the location of a local copy of Flot (e.g. ‘file:///home/user/stuff/flot’)
The official JavaScript API still applies here. Options are passed as name/value pairs, and the name may be ‘dotted’, like “series.lines.fill”,VF(0.2)“ means ‘series:{lines:{fill:0.2}}}’.
#include <llib/flot.h>

double sqr(double x) { return x*x; }

double *make_gaussian(double m, double x, double *xv) {
    double s2 = 2*sqr(x);
    double norm = 1.0/(M_PI*s2);
    int n = array_len(xv);
    double *res = array_new(double,n);
    FOR (i,n) {
        res[i] = norm*exp(-sqr(xv[i]-m)/s2);
    }
    return res;
}

int main()
{
    Flot *P = flot_new("caption", "Gaussians",
        "series.lines.fill",VF(0.2));

    double *xv = farr_range(0,10,0.1);

    flot_series_new(P,xv,make_gaussian(5,1,xv),
        FlotLines,"label","norm s=1");
    flot_series_new(P,xv,make_gaussian(4,0.7,xv),
        FlotLines,"label","norm s=0.7");

    flot_render("norm");
    return 0;
}
Functions
| flot_new () | new Flot plot. |
| flot_option (P, key, value) | set an option for a whole plot. |
| flot_text_mark (P, x, y, text) | attach text annotations to a plot. |
| flot_series_new_ (p, X, Y, flags, options) | new Flot series associated with a plot. |
| flot_series_option (S, key, value) | setting a Series option. |
| flot_create (title) | Create template data prior to rendering. |
| flot_render (name) | Render plots to a file, name.html. |
| flot_gradient (start, finish) | gradient between two colours. |
| flot_vert_region (x1, x2, colour) | coloured region between x1 and x2 |
| flot_horz_region (y1, y2, colour) | coloured region between y1 and y2 |
Functions
- flot_new ()
- new Flot plot.
- flot_option (P, key, value)
-
set an option for a whole plot.
Parameters:
- P Flot *
- key str_t
- value const void *
- flot_text_mark (P, x, y, text)
-
attach text annotations to a plot.
Parameters:
- P Flot *
- x double
- y double
- text str_t
- flot_series_new_ (p, X, Y, flags, options)
-
new Flot series associated with a plot.
If
YisNULL, thenXis interpreted as containing x and y values interleaved.Parameters:
- p Flot *
- X double *
- Y double *
- flags int
- options PValue
Returns:
-
Series *
- flot_series_option (S, key, value)
-
setting a Series option.
Parameters:
- S Series *
- key str_t
- value const void *
- flot_create (title)
-
Create template data prior to rendering.
Parameters:
- title str_t
Returns:
-
void *
- flot_render (name)
-
Render plots to a file,
name.html.Parameters:
- name str_t
- flot_gradient (start, finish)
-
gradient between two colours.
Parameters:
- start str_t
- finish str_t
Returns:
-
PValue
- flot_vert_region (x1, x2, colour)
-
coloured region between x1 and x2
Parameters:
- x1 double
- x2 double
- colour string
- flot_horz_region (y1, y2, colour)
-
coloured region between y1 and y2
Parameters:
- y1 double
- y2 double
- colour string